Generate and Graph Environment Sensor Data
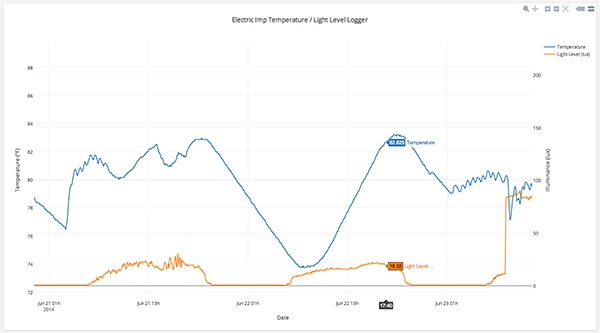
This example uses the EVB’s on-board TMP102 temperature sensor and TCS3472 color sensor to sample ambient temperature and light level at regular intervals and log the data to Plotly, a web service that lets users generate graphs of real-time data.
The sensors are both connected to the imp003/LBWA1ZV1CD’s I²C bus, so this example will also introduce you to the way this bus is implemented on the imp003/LBWA1ZV1CD and how you can support it in your code.
Peripherals Used
APIs Used
Setup
Create a Developer Account and add your EVB to impCentral™
- Create a free Developer Account to access Electric Imp impCentral and log in.
- Download the Electric Imp app from the App Store or Google Play store on your iOS or Android device, and log in using your Developer Account credentials.
- On the Connect an Imp page, select your WiFi network.
- The imp only operates using 2.4GHz 802.11b, g or n. 5GHz networks are not supported.
- Use BlinkUp™ to configure your EVB for Internet access. Power up the EVB then press Send BlinkUp in the Electric Imp app. As soon as you hear the countdown tones, place your tablet or phone’s screen against the EVB’s imp003/LBWA1ZV1CD breakout board until the screen stops flashing and you hear a second set of tones.


If you are having problems getting the EVB online, please consult the BlinkUp Troubleshooting Guide.
A successful BlinkUp operation is indicated by a slowly flashing green LED on the EVB. The EVB will be listed in impCentral’s ‘My Development Devices’ list (accessed via the devices menu in the black bar at the top). The number presented in impCentral is the EVB’s unique Device ID. You can, if you wish, give it a more friendly name as follows:
- Click ‘Settings’ in the ‘MANAGE’ column.
- In the ‘Device Settings’ panel, enter a new name, eg. ‘LBWA1ZV1CD EVB’, ‘imp003 EVB’ or ‘My EVB’, and click ‘Update’.
Create a New Product and Device Group
- Click on your account name in the grey bar at the top of the window to view a list of your Products — this will be empty initially.
- Click ‘Create New Product’.
- Enter a name for the Product: “EVB”.
- Enter a name for the first Device Group: “Logging”.
Add Code
- Copy the device and agent code from our GitHub repo and paste it into the impCentral’s code editor ‘Device Code’ and ‘Agent Code’ panes, respectively.
- Create a Plotly account at the Plotly website.
- Enter your Plotly account details into the agent code, where indicated — look for the constants PLOTLY_USER and PLOTLY_KEY. You will need your Plotly username and API key.
- Click ‘Build and Force Restart’ to transfer the device code to the imp003/LBWA1ZV1CD and the agent code to Electric Imp impCloud™, and to run them.
What’s Going On
This example centers on the imp API’s classes written to manage devices connected to the imp003/LBWA1ZV1CD’s I²C bus. The code shows how the bus is configured; essentially it’s just a matter of selecting which pins you wish to use and the bus speed. For a detailed guide to configuring the imp003/LBWA1ZV1CD’s I²C-compatible pins for operation, see the i2c.configure() method documentation. Our I²C Explained Developer Guide provides an overview of the bus and its use.
The device code used to manage the TMP102 digital temperature sensor and the TCS3472 color sensor is implemented in the form of two classes. The Squirrel language used to program the imp003/LBWA1ZV1CD and its agent is an ‘object-oriented’ one: it is designed to facility the creation of modular code based on units called ’objects’, each a specific instance of a generic case, or ‘class’. We’ll look at how classes are constructed in a later example; for now, it’s enough to know that by implementing the TMP102 code and the TCS3472 code as separate classes, we have made it easy to copy either or both blocks of code into other projects where we can use them in exactly the same way we do here.
The device code will regularly read each sensor — each device’s I²C address is used to direct the bus traffic — and then send both values to the agent. We’ll explore device-agent interaction more fully in a later example. The agent code will then format the data, add styling and graphing options, and send it as an HTTP request to Plotly, which adds the data to the graph. This is the agent’s job: to operate as a mediator between device and Internet services and resources.

For more detailed information about how the device and agent applications communicate with each other, and further afield, see the Interactive imp Developer Guide.
Internet communication is achieved with the imp API’s http object. Here we use it to fashion an HTTP request containing the latest sensor readings into a form Plotly can understand, extract the stored data and add it to a graph you can view when you log in to the right Plotly page.
So you know which page to access, when the agent code runs for the first time, the URL of your Plotly graph will be displayed in the impCentral code editor’s Log pane. Cut and paste this URL into another browser tab or window.
By default, the range of the graph’s x-axis is set automatically and will include all of the data logged thus far. At first, this makes it easier to see results quickly. As your dataset grows, however, it’s more convenient to have a fixed window size. To do that, disable auto range by setting autorange=false at line 32 of the agent code. The window size can then be changed by modifying the GRAPH_WINDOW constant in line 10.
Don’t worry about how the code works; we’ll look at formatting HTTP requests to be sent to web services in a later example. For now, you can see how the imp003/LBWA1ZV1CD can interact with connected peripherals, gather data and forward it to its agent, which can in turn log that data with a third-party data storage or analysis service.
In the next section, we’ll explore working with the imp003/LBWA1ZV1CD’s audio input facilities.